Clare

Which teams are rostered on skills they can't prove?

Three teams: Customer Care, Retail and Managers. Customer Care is the largest, with 180 people rostered on skills they can't yet demonstrate.

Workforce ready

1,385 assignees

Capability risk

Customer Care reports 76% confidence against 41% demonstrated capability.

We help you measure actual results

ClearXP turns learning, skills and performance data into a clear view of workforce capability.

Using xAPI analytics and AI-powered insights, organisations can identify capability gaps, measure learning effectiveness and connect development activity to business outcomes.

Get started

Measure what people actually know and can do

Traditional reports show who completed a course. ClearXP captures the evidence underneath it.

Steve P. Hazard Identification Completed
  • Viewed all modules 100%
  • Knowledge check score 8/10
  • Practised in simulation 2 attempts
  • Applied on shift Not started

Beyond completions

Capture evidence of how people understand, practise and apply knowledge. Not just completion metrics.

  • Understanding
  • Confidence
  • Decision-making
  • Angela L. completed Course
  • Sam K. completed Assessment
  • Jordan P. completed On shift

Capture the full experience

Rich engagement data from courses, simulations, videos, assessments and workplace activities.

  • Learner decisions
  • Skills demonstrated
  • Behaviour over time
Where are learners struggling?

Night Fill: 41% fail the applied check on Hazard ID.

Ask, don't dig

Ask questions in plain language and get clear answers about performance, capability and learning impact.

  • Where learners struggle
  • What to update
  • Who needs support

Understand true capability

Align learning to your skills frameworks, prove it was applied and see confidence versus competence.

  • Hazard identification
  • Food safety
  • Manual handling
  • De-escalation

2 skills below role requirement

A live view of readiness

Connect learning to your skills frameworks and role profiles for a live view of workforce readiness.

  • Role requirements
  • Capability gaps
  • Readiness over time
High confidence, low skill
High confidence A chart of learners by confidence and skill. Three learners have high confidence but low skill. Low confidence Low skill High skill

Confidence isn't competence

Measure role readiness by capturing confidence and competence through real skills demonstration.

  • High confidence, low skill
  • Ready for more

Hazard Identification

  1. Completed 14 March Course
  2. Understood 14 March 9/10 score
  3. Applied 20 March Verified

Prove more than participation

Track whether learning was completed, understood and applied backed by audit-ready records.

  • Knowledge checks
  • Skills verification
  • Audit-ready

Connect learning to business results

See how learning activity relates to performance, track it against real KPIs and prove the return.

Learning activity
Error rate

Learning and what happens next

Explore how learning activity connects to productivity, quality, safety and customer outcomes.

  • Productivity
  • Quality
  • Safety

Time to competence

A progress bar that passes its target line.

26 days to full capacity

From activity to outcomes

Connect learning initiatives directly to the KPIs they're intended to influence.

  • Faster onboarding
  • Reduced errors
  • Higher productivity
Invested
Return

+2.4 x return on investment

Prove the value

Quantify the impact of learning investment, with the evidence to show where it's working and what needs improvement.

  • Time to competence
  • Reduced rework
  • Readiness
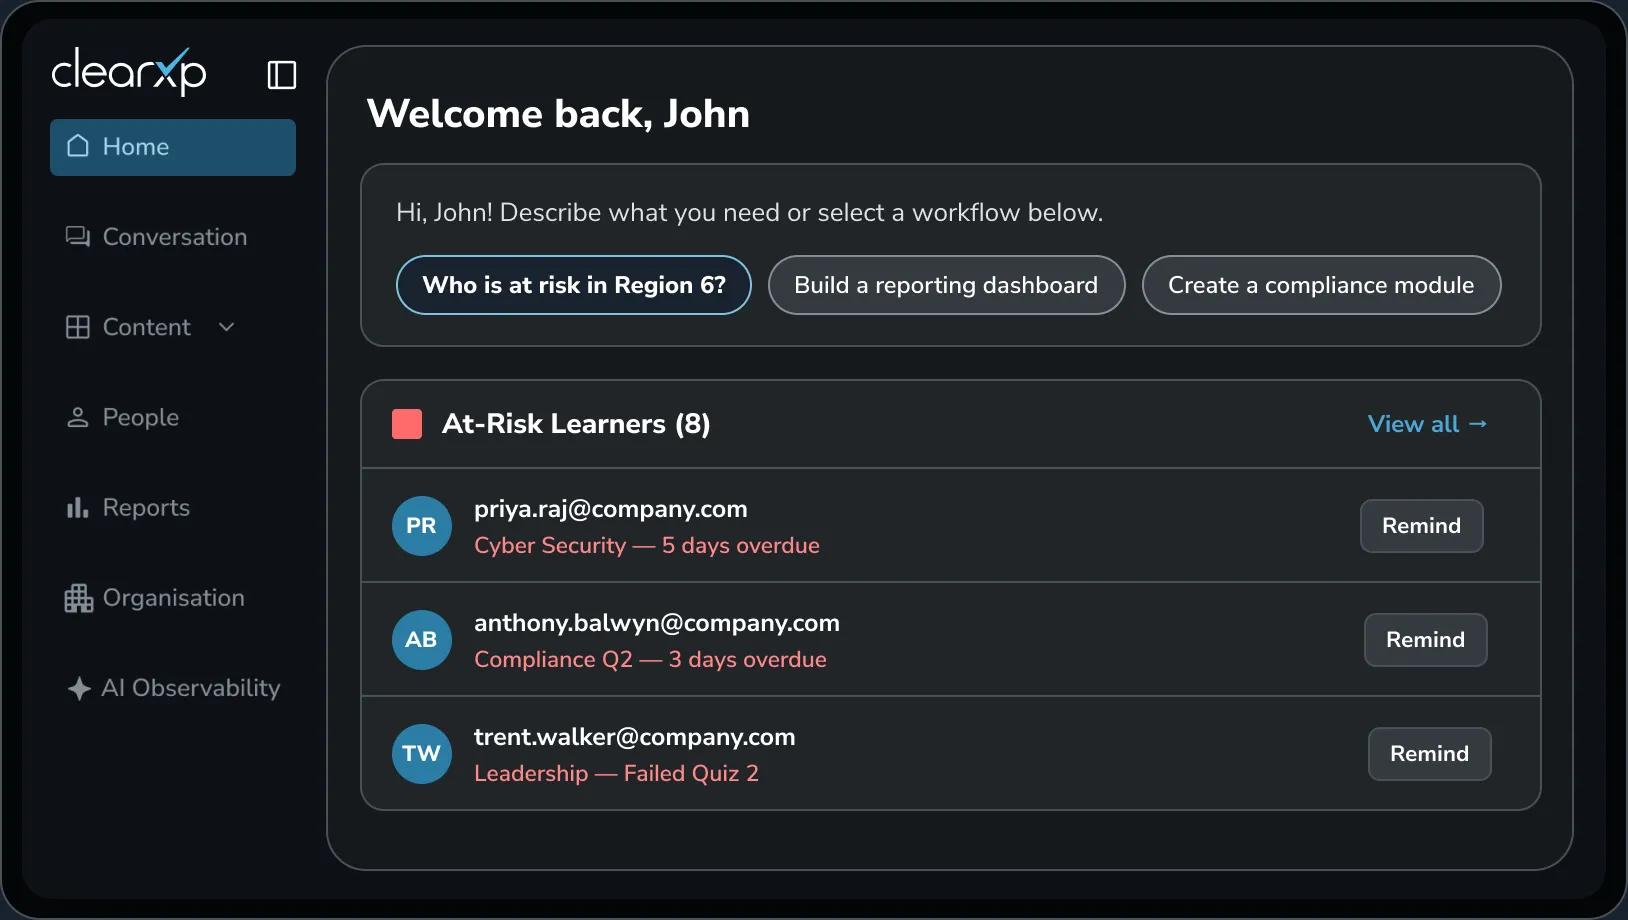
A ClearXP executive dashboard. Clare suggests questions such as “Who is at risk in Region 6?” and lists 8 at-risk learners with overdue or failed modules.

Give leaders the information they actually need

Executive dashboards translate learning and capability data into a clear view of workforce performance.

Tailored by role, business unit, program or strategic priority so every leader sees the view that matters to them.

Visibility into

  • Workforce readiness
  • Capability risk
  • Learning effectiveness
  • Compliance status
  • Skills gaps
  • Performance trends
  • Business impact
  • Return on investment

From data to action

  1. 1 Capture Collect rich learning and performance data through xAPI and connected systems.
  2. 2 Analyse Use AI, skills frameworks and capability models to interpret what the data means.
  3. 3 Understand Identify gaps, risks, trends and opportunities across the workforce.
  4. 4 Act Recommend learning, reinforcement and performance support based on evidence.
  5. 5 Prove Connect capability improvement with measurable business outcomes.

Prove what your people can do

ClearXP gives learning teams, business leaders and executives a shared view of workforce capability, risk and performance.

Move beyond reporting what people completed and start proving what they can do, where support is needed and how learning contributes to better business outcomes.

Book a demo

ClearXP works alongside the systems you already use. No need to replace your current LMS.

  • LMS
  • Simulations & assessments
  • Existing xAPI sources
  • BI tools
  • Performance systems
  • Skills frameworks
  • HR systems